
Visual Reports
Turn results into clear communication - for practitioners and patients alike.
What Eyeli generates
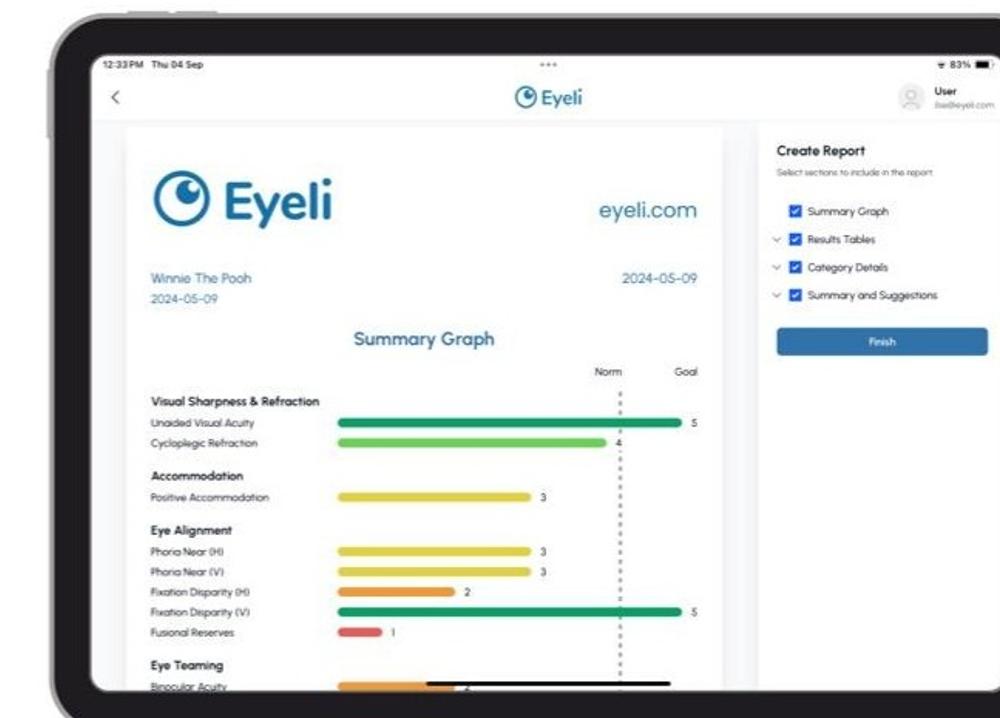
After a consultation, Eyeli automatically compares all results against the patient's age-related norms and compiles a structured visual report. The report includes:
- A summary graph across all test categories
- Result tables with normative comparisons
- Category detail breakdowns
- A section for clinical summary, diagnosis, and treatment recommendations
Customisable before sharing
The generated report is a starting point, not a final document. Practitioners can edit the clinical summary, diagnosis, and recommendations to reflect their own clinical judgement before sharing.
Eyeli generates the report automatically, but the clinical summary section is yours to personalise with your diagnosis and treatment plan before sending to patients.
Sharing with patients
Visual reports are designed to be patient-friendly - clear, readable, and understandable without a clinical background. They can be shared directly from Eyeli.